GALLERY OF IMAGES
| LIDARS |
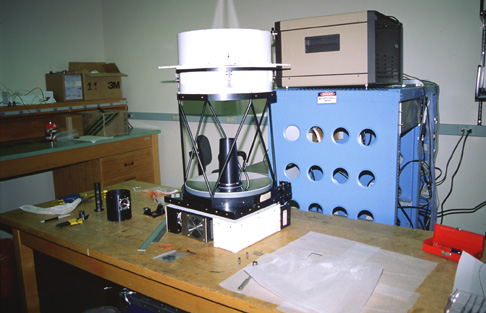
Sable lidar image of the boundary layer
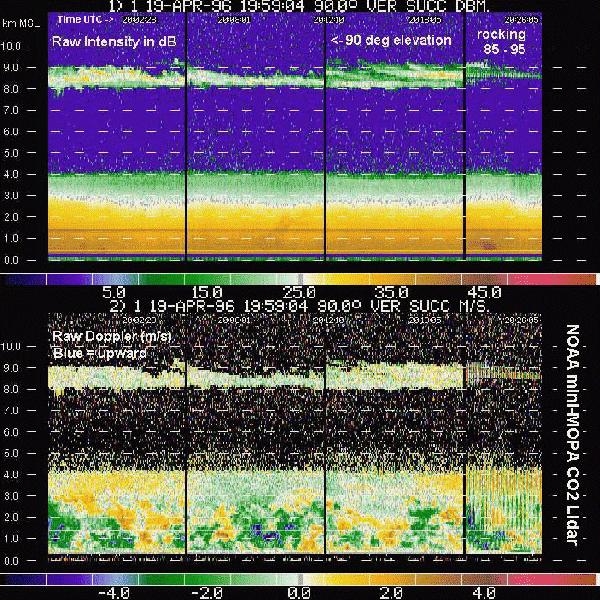
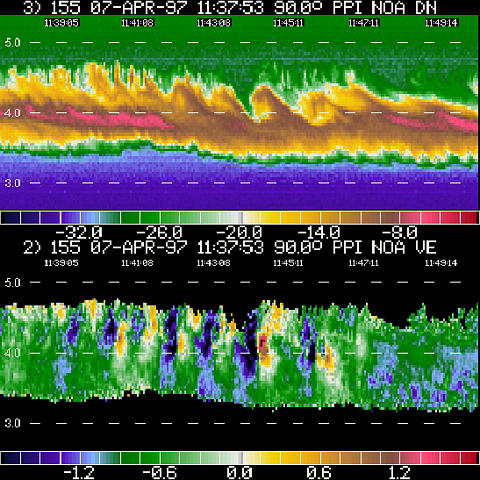
Time-height display of the NOAA lidar data
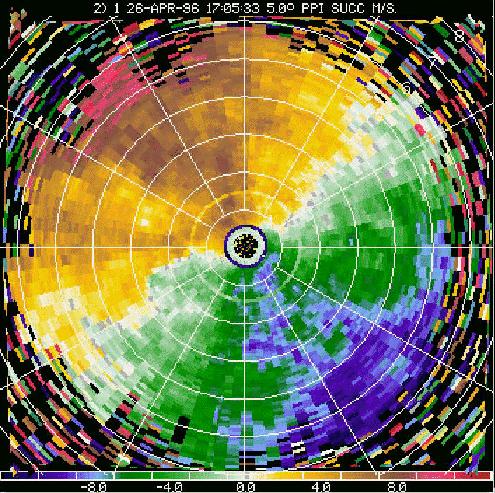
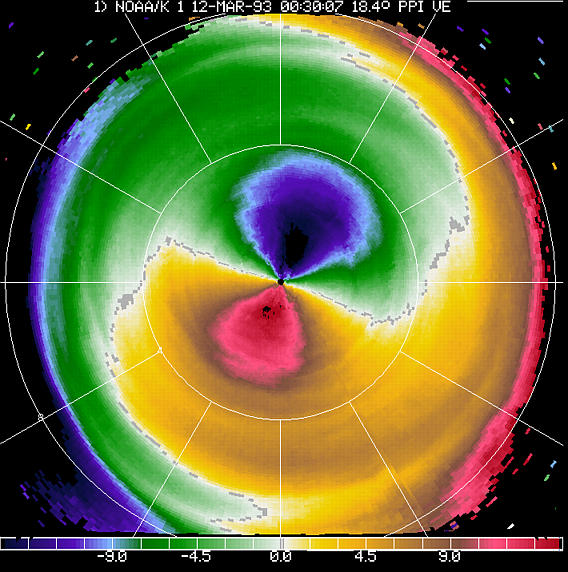
PPI display of the NOAA lidar data
| Back to the top of the Image Gallery. |
| AIRBORNE RADARS |
Eldora and the Electra in the air
NOAA P3 and NCAR Electra on the ground
Eldora data showing the deepening inflow into a supercell thunderstorm
Eldora data showing a Hail recirculation pattern
Eldora data showing another Hail Recirculation pattern
Eldora cross section through a tornado
Eldora cross section through a supercell showing major attenuation
Dual-Doppler wind field associated with a supercell Hook Echo
Eldora clear-air data through the dryline and HCRs
Eldora clear-air data in the boundary layer
Eldora data through a sharp dryline
| Back to the top of the Image Gallery. |
| CLOUD (K BAND) RADARS |
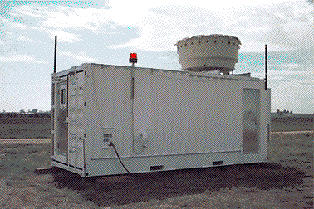
Photo of NOAA's K band cloud radar
Photo of NOAA's vertically pointing cloud radar
Amazing images from the K band cloud radars.....
VAD showing major vertical shear
K-H waves on top of stratocumulus
K-H waves in a strongly sheared environment
Freezing rain and the bright band!
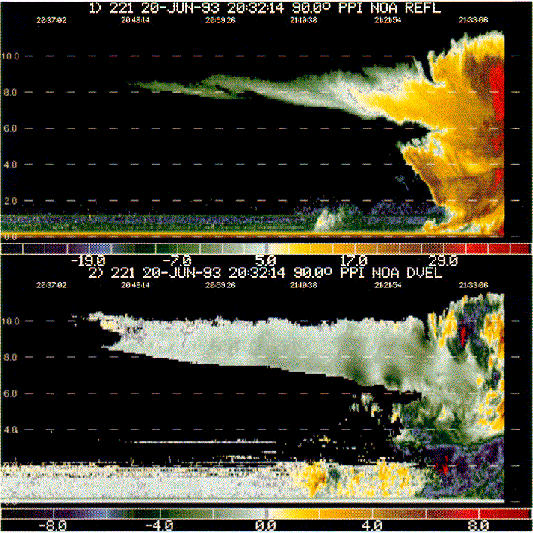
Insects and Virga in the boundary layer
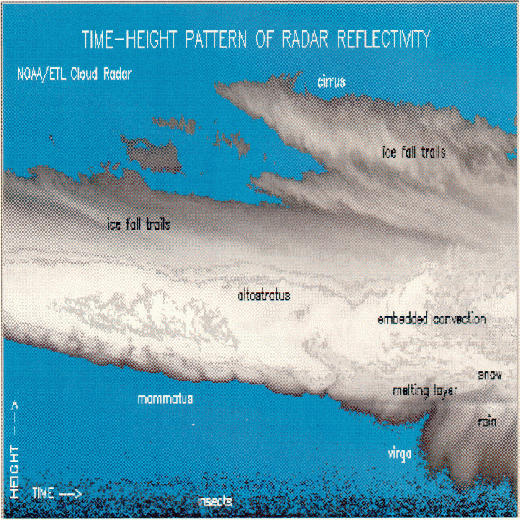
precipitation types in a convective storm
| Back to the top of the Image Gallery. |
| GROUND-BASED MICROWAVE RADARS |
Cross section through gust front and parent storm with X band radar
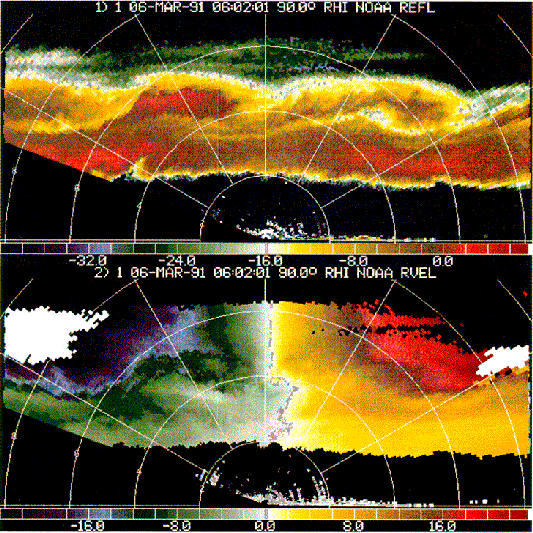
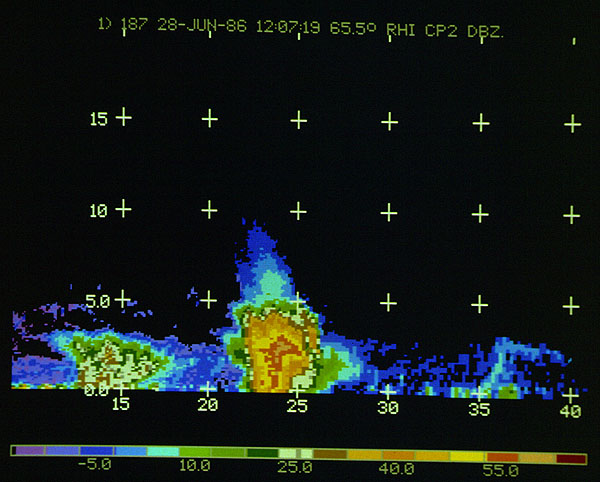
RHI through an isolated thunderstorm
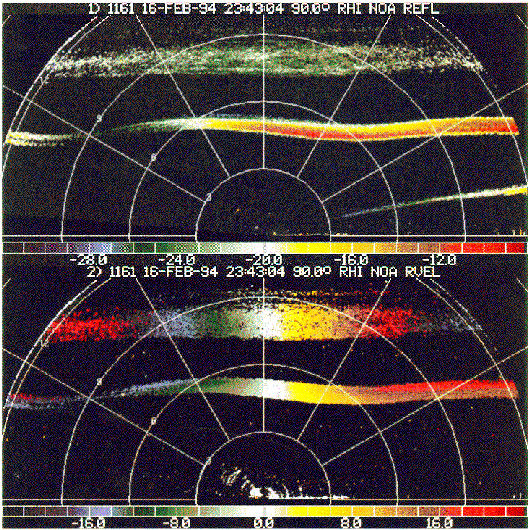
RHI through a series of thunderstorms
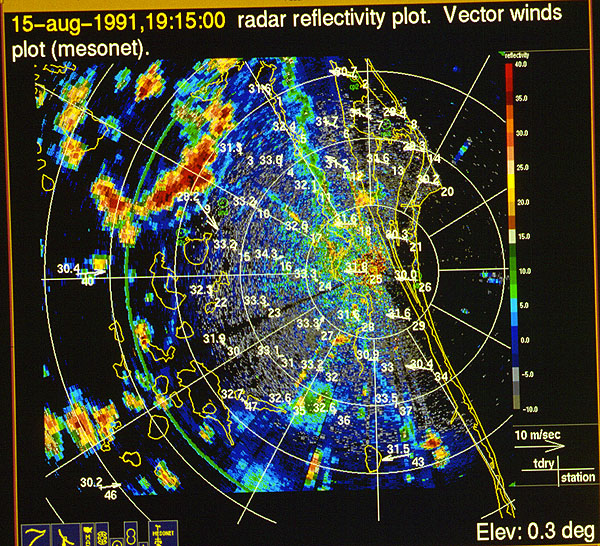
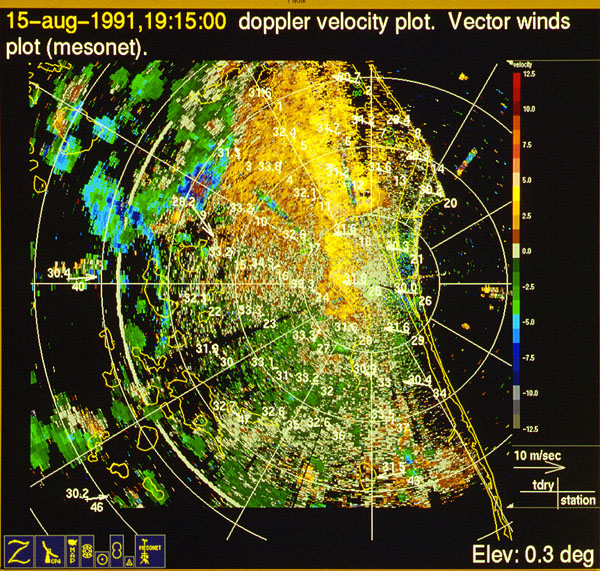
Line of thunderstorms/sea breeze on 15 Aug, 1991 - Reflectivity Velocities
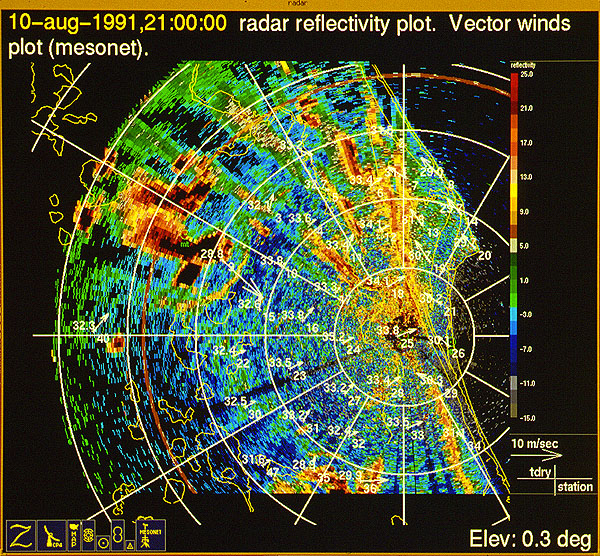
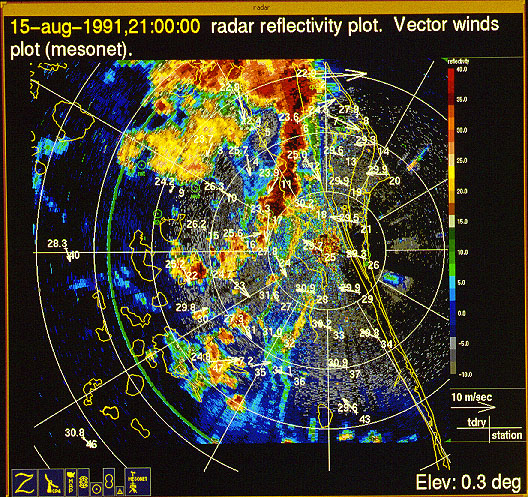
Squall line over Eastern Florida
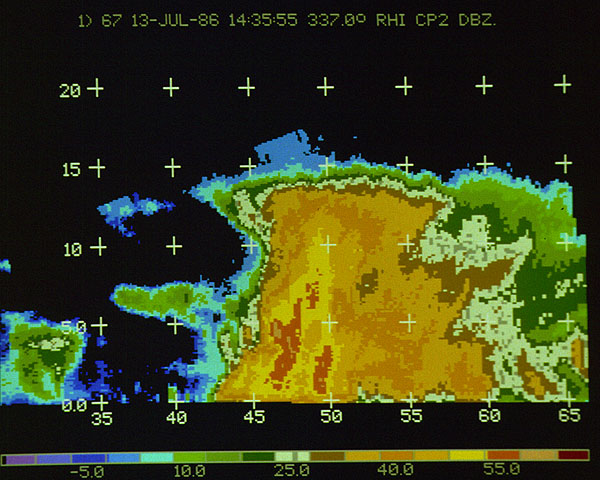
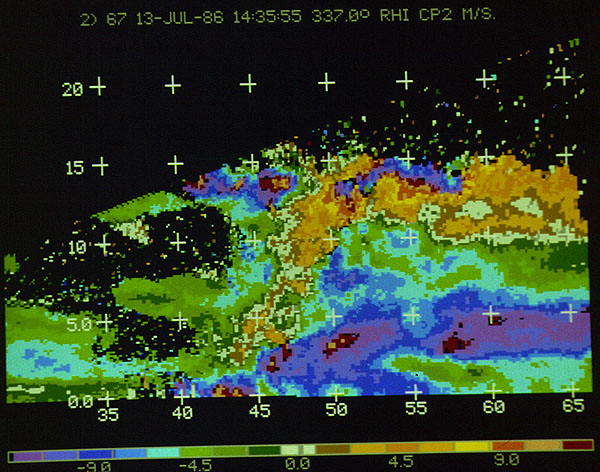
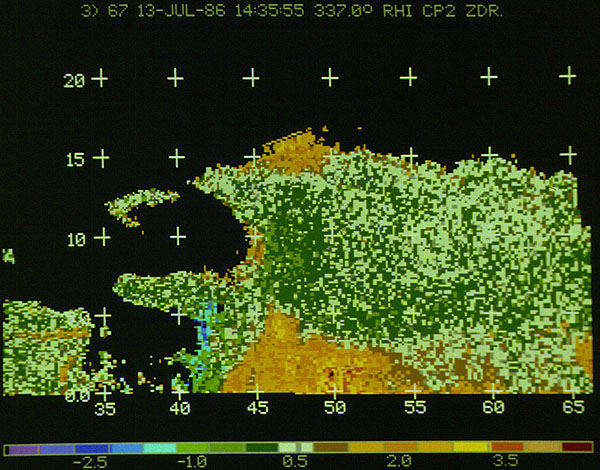
RHI through a large thunderstorm - Reflectivity Velocities ZDR
88-D data of a supercell observed over NE Colorado:
| Radar Reflecitvity | 0.5° | 1.5° | 2.5° | 3.5° |
| Doppler Velocity | 0.5° | 1.5° | 2.5° | 3.5° |
88-D images of a circular outflow boundary: Reflectivity Doppler Velocities
88-D images of a Supercell: Low-level Hook and velocity couplet and upper level divergence with the updraft
88-D images of another Hook Echo associated with a Supercell: Reflectivity Velocities
88-D images of a Squall line Event (Derecho): Low-Level Reflectivity Low-Level Velocity Upper-Level Reflectivity
88-D Clear-Air data of a dryline observed over the Texas Panhandle
3 mm radar images of a hook echo within a supercell Reflectivity Velocities
Two examples of boundary layer convection, HCRs and open cells
Collision of a seabreeze front and a gust front over eastern Florida Reflectivity Velocities
PPI of a freezing Rain Storm in a sheared environment with a distinct bright band
RHI of a freezing Rain Storm in a sheared environment with a distinct bright band
Clear air data of a boundary layer convergence zone (The Denver Convergence Zone)
RHI through a big thunderstorm showing the updraft, folded velocites in the downdraft, divergence aloft, and a possible hail recirculation observable in the radial velocity and reflectivity data: Reflectivity Velocities
(BWER- Bounded Weak Echo Region- They indicate the location of a very strong updraft)
PPI scan of a microburst: Reflectivity Velocites
A sea-breeze front and Horizontal Convective Rolls observed over Florida
A sea-breeze front, Horizontal Convective Rolls and a Gust Front Observed over Florida
Evolution of an offshore flow sea-breeze event
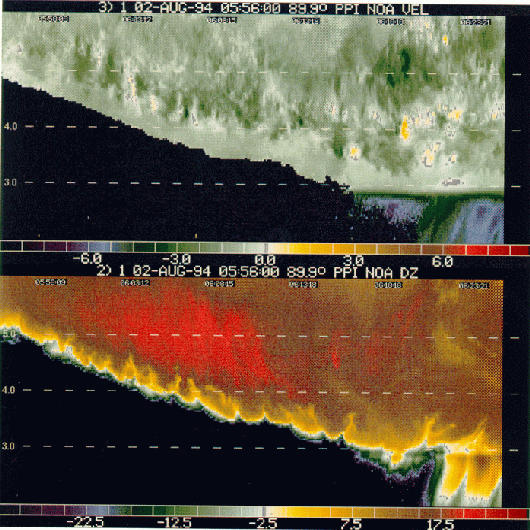
Horizontal Convective Rolls observed over Eastern Florida on 6 August, 1991
Sea-breeze and a gust front observed over Eastern Florida Reflectivity Velocities
A GREAT example of warm air advection from Burlington's 88-D Reflectivity Velocities
Another GREAT example of warm air advection from Burlington's 88-D Reflectivity Velocities Satellite Surface
A NICE example of destabilization, warm air advection at low levels and cold air advection aloft Velocities Reflectivity
| Back to the top of the Image Gallery. |
| DOW (DOPPLER ON WHEELS) |
Supercell with major hook echo
Hook echo before tornadogenesis
Reflectivity and radial velocity fields of young tornado
Reflectvitiy and radial velocity fields of mature tornado
Also, check out the DOW web site for more information and images
| Back to the top of the Image Gallery. |
| PROFILERS |
915 Mhz Profiler winds in High mode
915 Mhz Profiler winds in Low mode
915 Mhz Profiler vertical velocity in High mode
915 Mhz Profiler vertical velocity in Low mode
Profiler sees a Mesoscale Convective System
Profiler sees a freezing rain storm
Profiler sees jet stream cirrus
| Back to the top of the Image Gallery. |
| SODARS |
Example of Sodar derived vertical velocities
Combine profiler and sodar wind profile
| Back to the top of the Image Gallery. |
| RASS |
Photo of RASS and 915 MHz profiler
Example of boundary layer temperature evolution from RASS
Another example of boundary layer temperature evolution from RASS
| Back to the top of the Image Gallery. |
| SATELLITE DATA FROM GOES 8 AND 9' |
Goes 8 visible image of a Lake Effect Snow
Goes 8 visible image of a "lake effect" snow field
Snow field created by the "Great October Blizzard of 97"
Gravity Waves over the North East
| Back to the top of the Image Gallery. |
Last update: December 31, 2003 07:49